Comparing investor perspectives directly
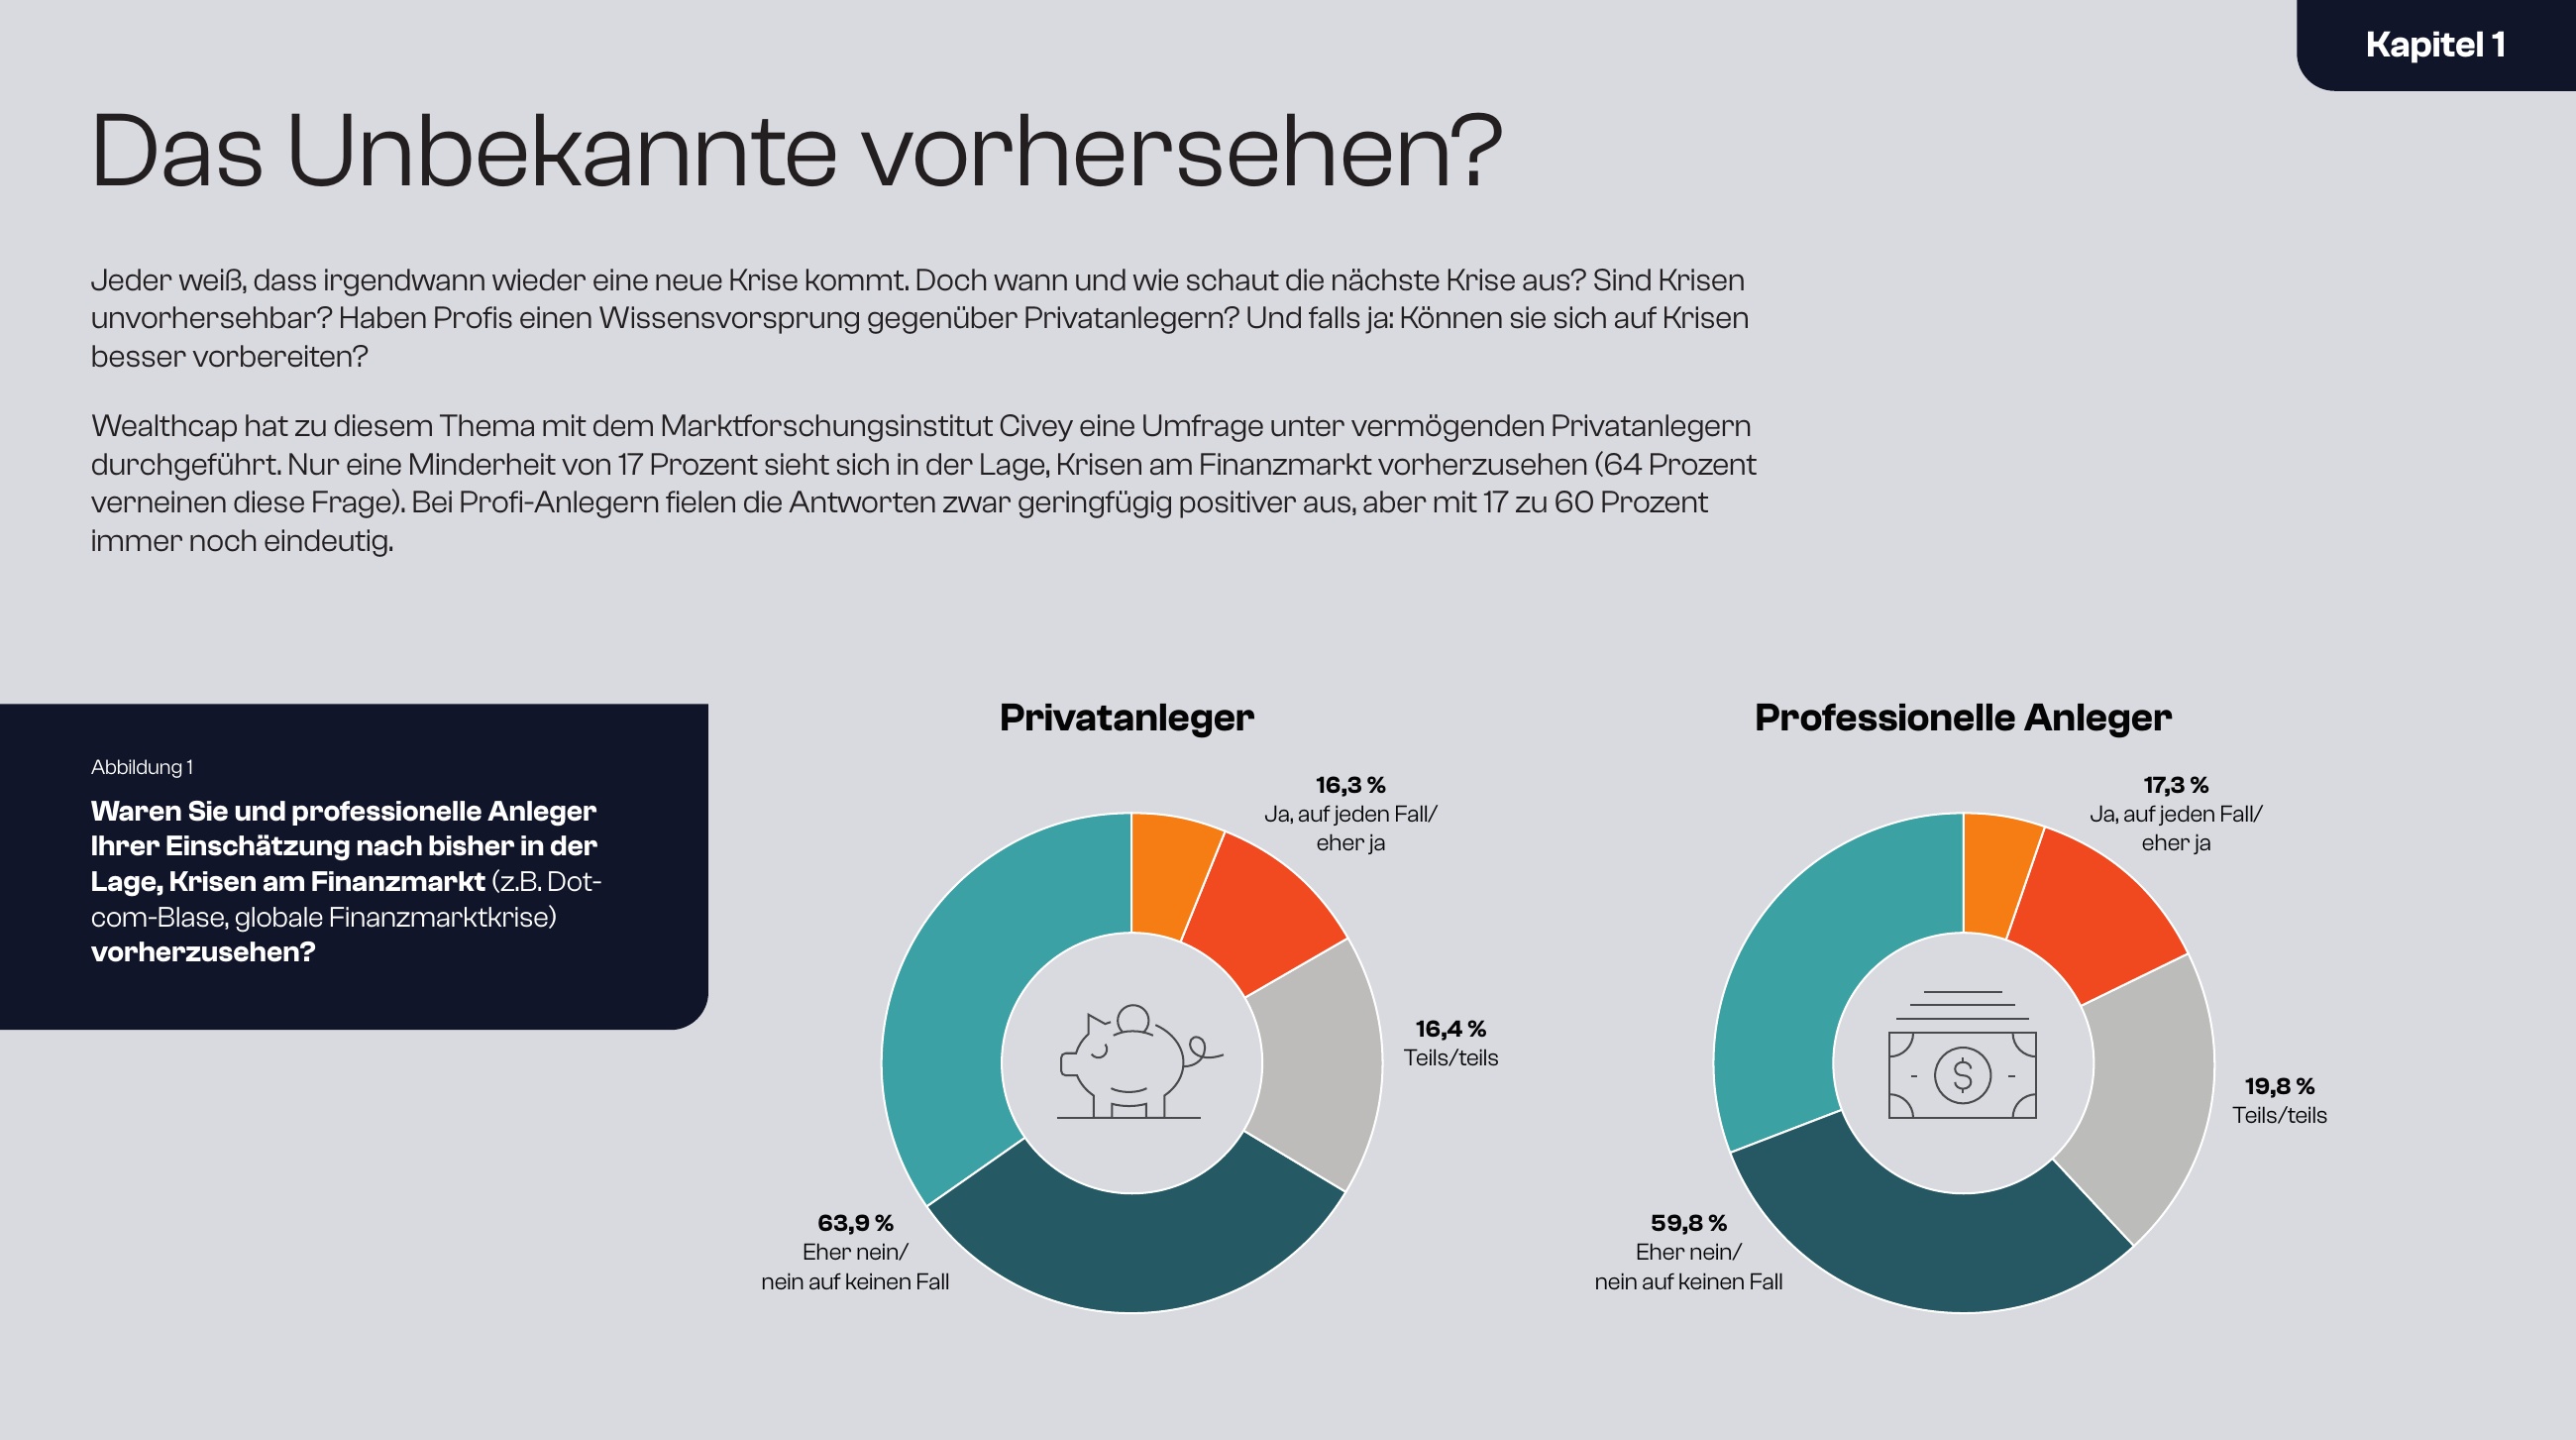
Two doughnut charts compare the views of private and professional investors. Consistent colours, clearly positioned percentages and concise illustrations make similarities and differences easy to grasp.
Information Design / Data Visualisation
Making complex financial topics
visually accessible.
Concept development and design for Wealthcap Research: structuring specialist content, understanding connections and translating them into accessible visuals.
01 / My contribution
My contribution covered the visual presentation of specialist content and the development of individual graphic concepts. Depending on the task, I refined existing material or researched the subject myself. I discussed initial designs with subject-matter experts and refined the visuals together with them.
My role combined design execution with conceptual work. Our discussions focused on understanding relationships and finding clear ways to communicate them. My colleagues’ subject expertise and my design perspective complemented each other.

02 / The task
The topics were often complex and not immediately visual. My task was to present figures and relationships so they became easier to understand and quicker to grasp.
In a regulated environment, this does not mean simply removing complexity. Risk warnings, mandatory disclosures and legal requirements had to remain complete and accurate. The design needed to provide clarity within those constraints.
03 / Approach
An initial visualisation made my understanding of the content visible. Discussions with subject-matter experts helped verify and refine that understanding. I then revised the design.
This cycle of understanding, designing and discussing shaped my approach. Design also became a way to clarify the task itself.
04 / Selected work
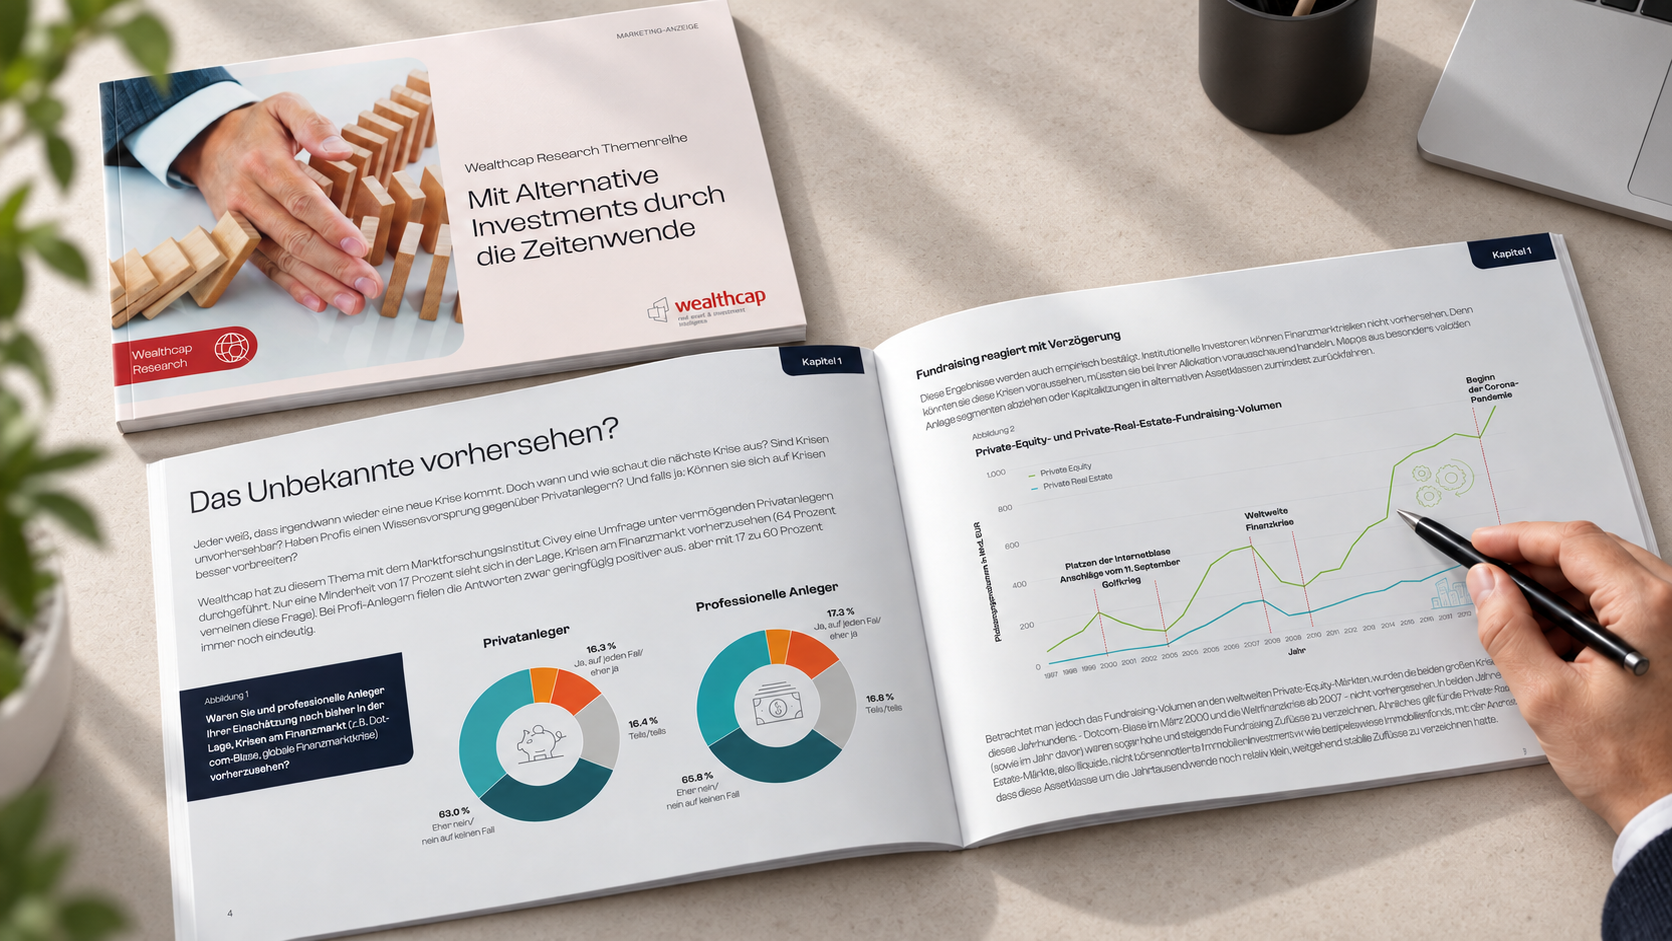
The following pages come from the German research publication “Mit Alternative Investments durch die Zeitenwende”. They address two different tasks: making audience groups directly comparable and placing long-term data in context.

Two doughnut charts compare the views of private and professional investors. Consistent colours, clearly positioned percentages and concise illustrations make similarities and differences easy to grasp.
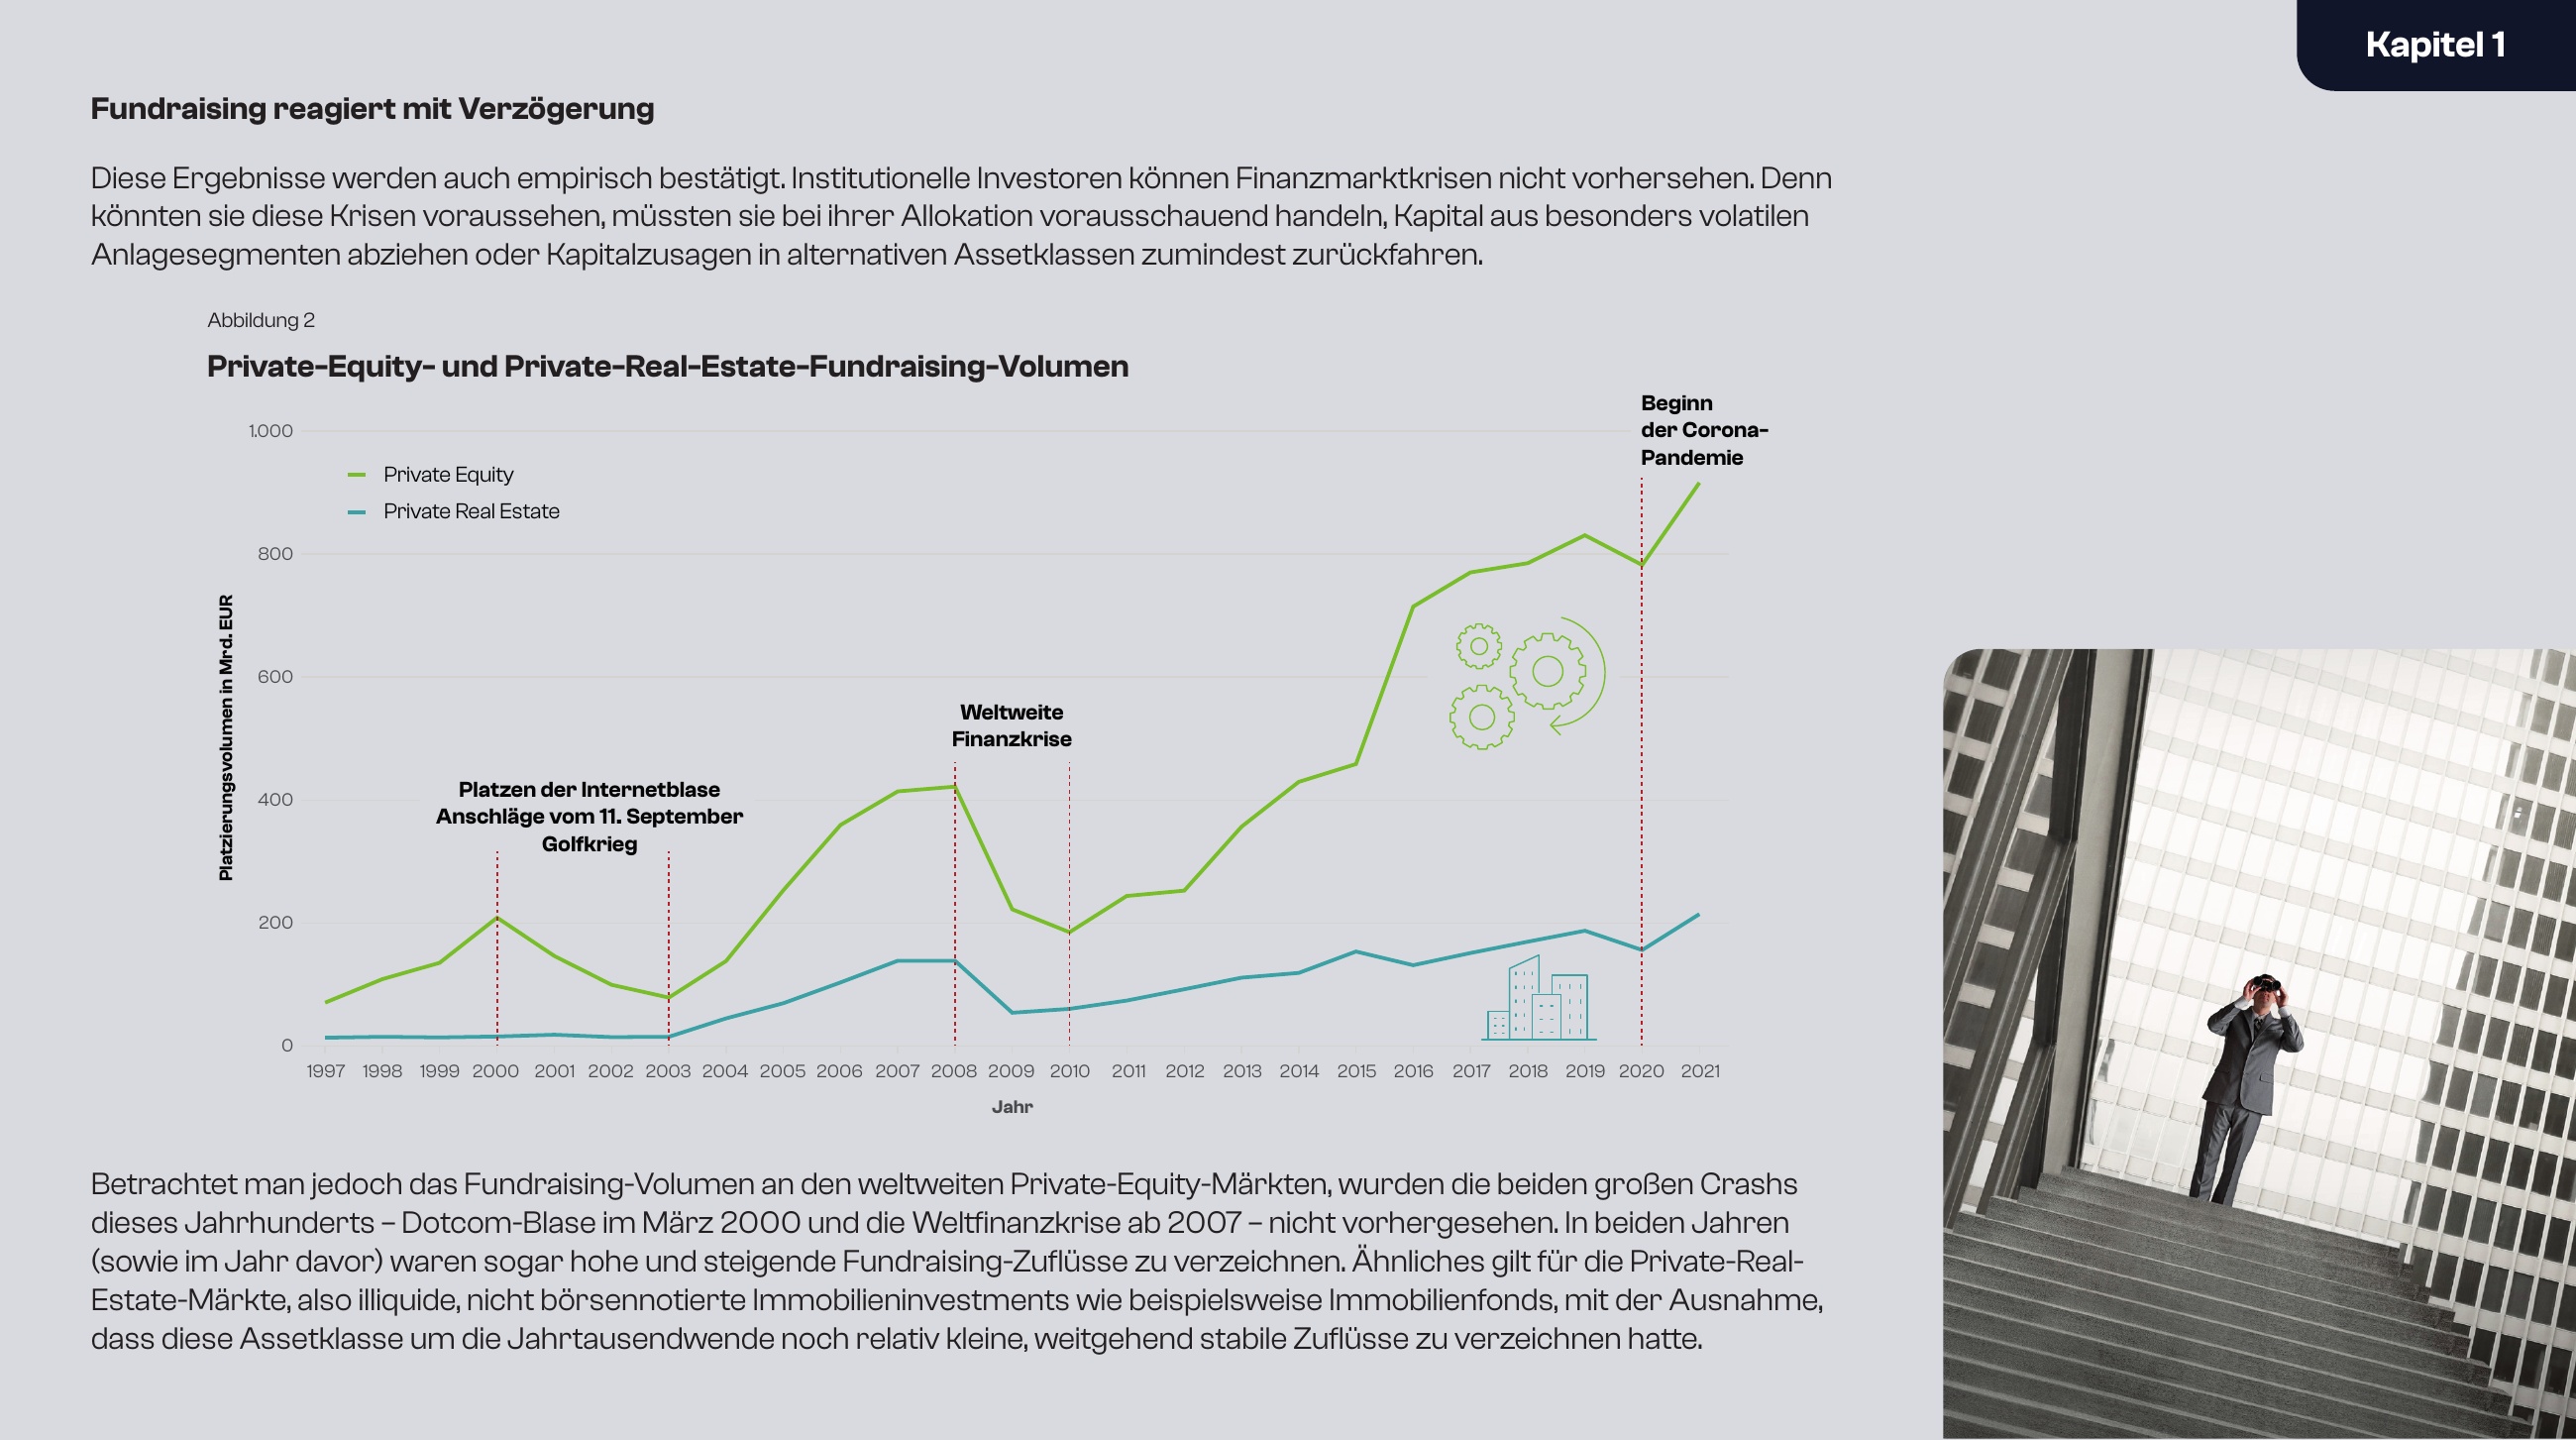
Private equity and private real estate fundraising volumes are shown across more than two decades. Highlighted crises and the accompanying commentary connect the data with its wider meaning.
05 / Reflections
Working with Market Research strongly influenced my positioning today. To communicate something clearly, I first need to understand it myself, and be willing to revise that understanding.
I combine that experience with my design craft: listening, understanding connections, developing a solution and refining it through informed discussion.
More about my approach in my personal brand book